
3. Google Forms and Pandas Data Import and Visualization#
Learning Objectives
Be able to use google forms to create a survey
Be able to write a short python code to read the survey results and present in a table format
Be able to write a python code to analyze the table results displaying statistics on each numerical question (mean, median, std, 95% conf interval, t-test comparing column results)
Be able to write a python code to visually represent the data as a barchart, pie chart, scatter plot with error bars, etc.
3.1. Creating your own poll using Google forms#
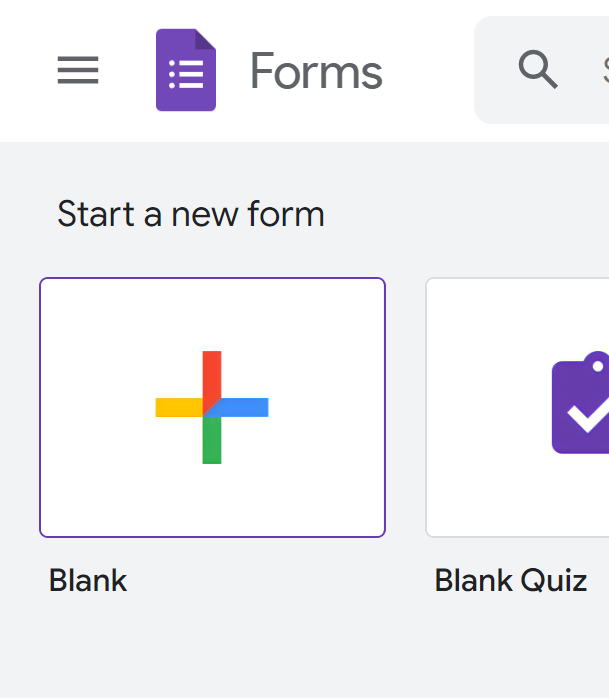
Open a Google form from your browser using the “Google apps” navigator icon shown below. This assumes you are logged in to your google account.

Scroll down and open “Forms”.

Click on the “+” icon to create a new form (survey).
You should see the following:
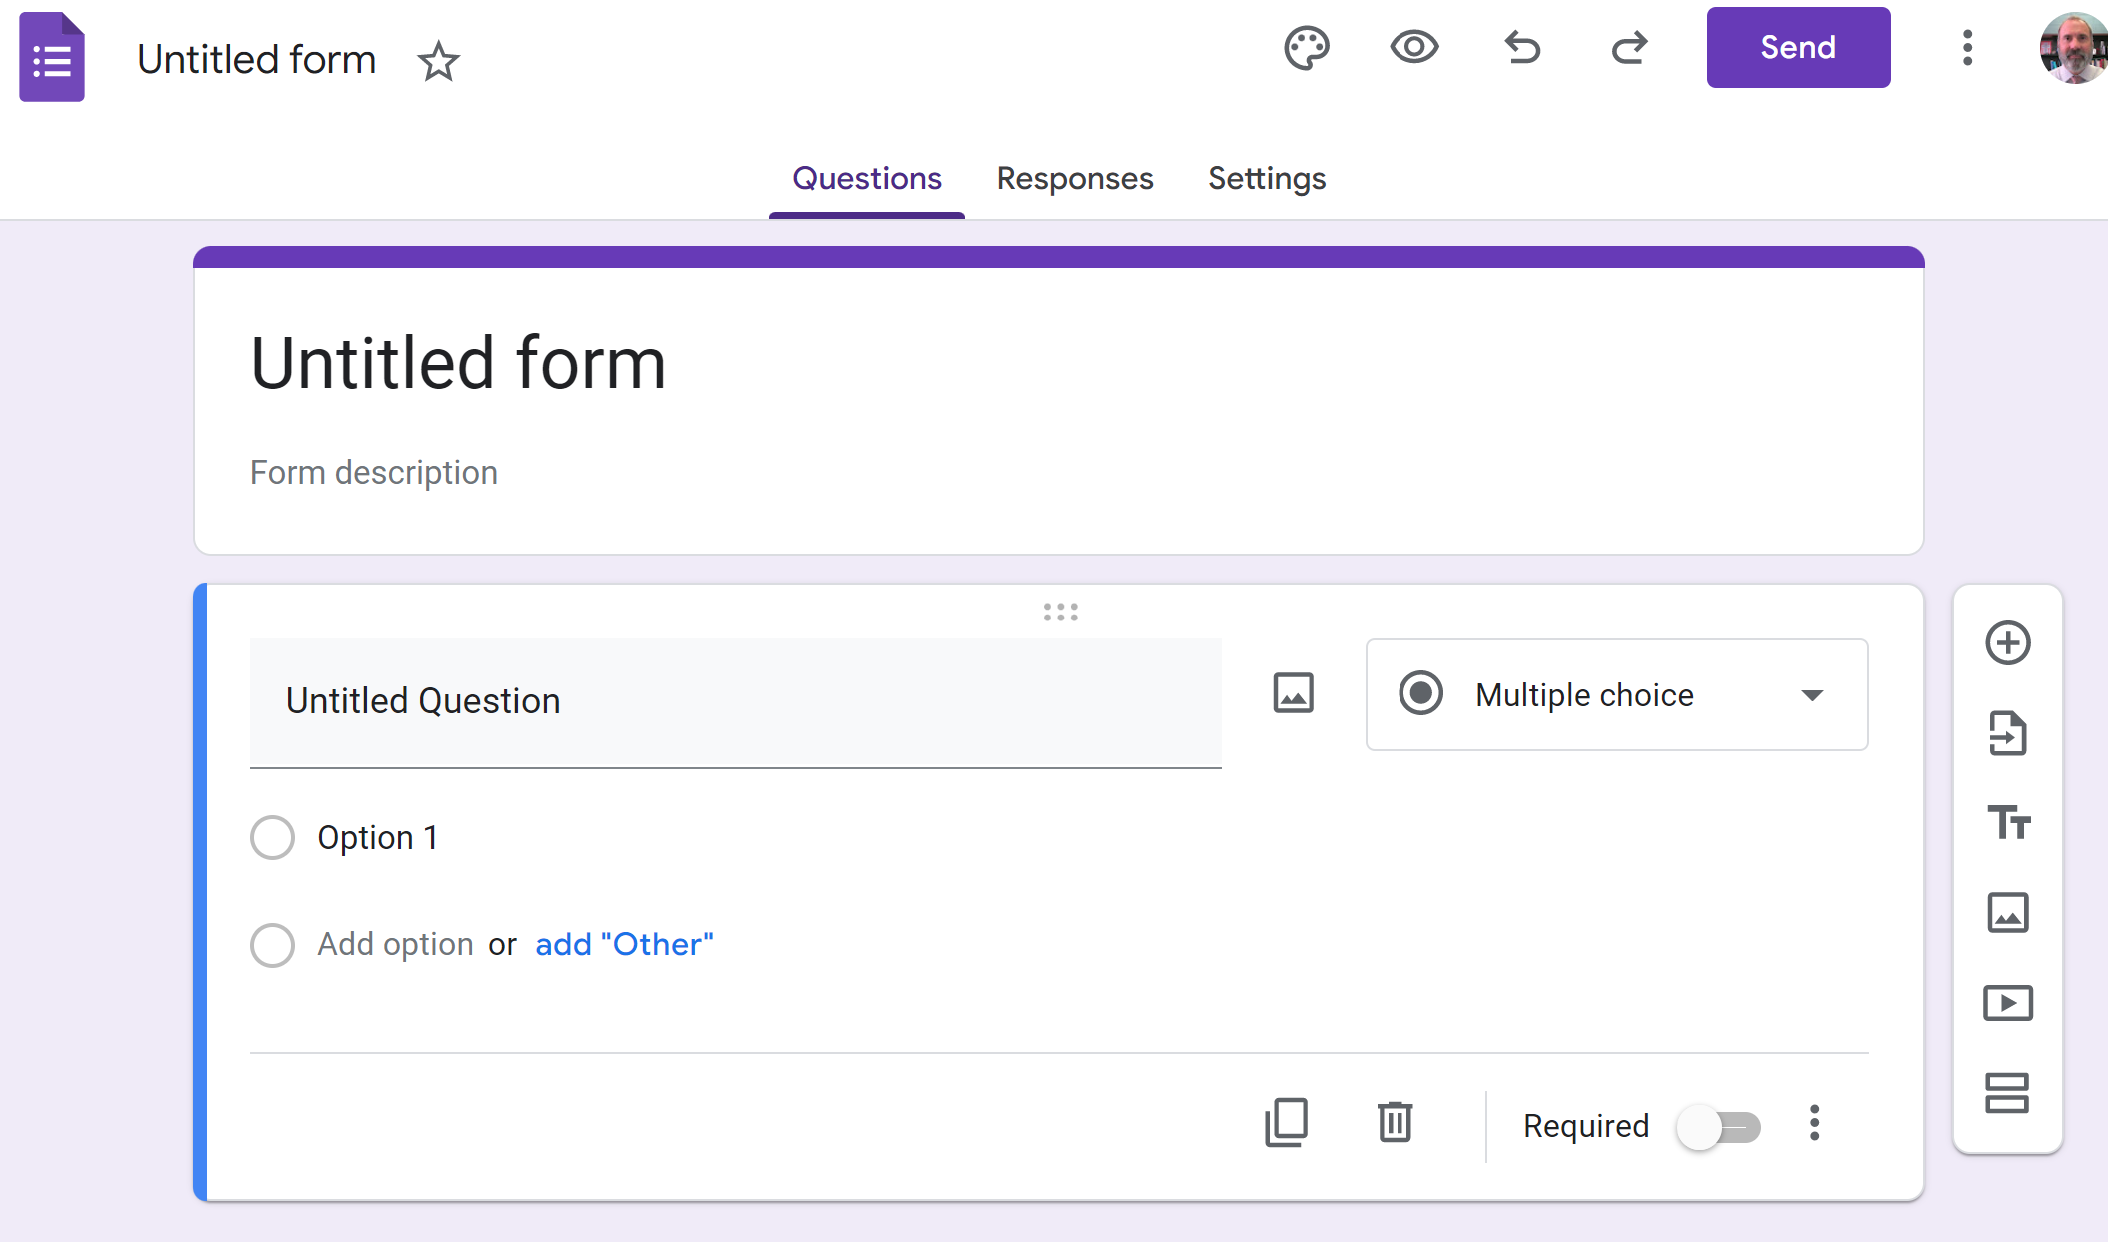
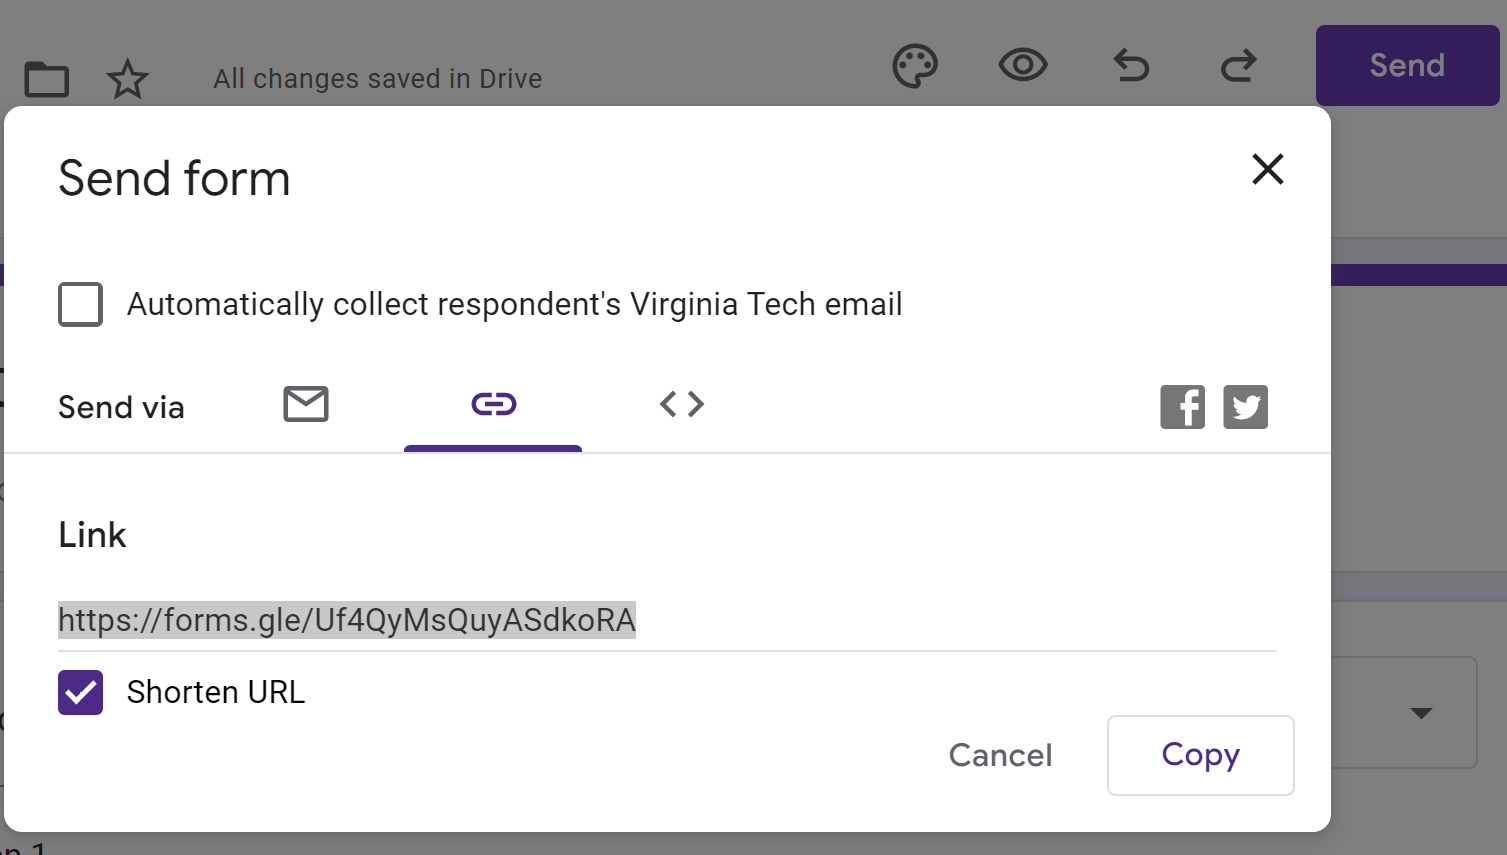
Play around with this form to add questions, change question types, etc. When you are finished with your form, click on the “Send” button. In the “Send form”, shown below you can click on the link icon and copy the link address. This can be pasted into an email and sent.
Active Poll
Take this 30 second poll on your drink preference and then we will analyze the data below. https://forms.gle/utT4aii7tWLdesZr9
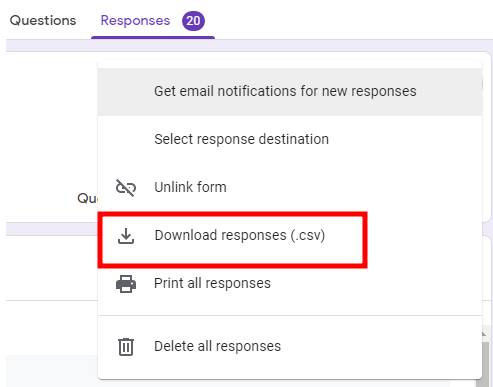
Send your survey to a few people so you can collect some data. Then, under the Responses tab of your created survey, you will see an option to download responses.
Then we need to extract the zip file that was downloaded. If you don’t know how to extract a zip file, use Google to search “how to extract a zip file”.
Extracting the zip file creates the folder “MSE 3114 drink pref.csv” Yes this is a folder. The “.csv” here is not actually an extension. If it bothers you, rename the folder.
Rename this folder to data. I just don’t like the long name.
3.2. Import and analyze the data#
import os  #we use this to join our file path to our filename
import numpy as np
import pandas as pd
import matplotlib.pyplot as plt
from scipy import stats #we will use this to perform a t-test
# To read a csv file on your own computer
# path = r'C:\Users\Sean\Downloads\data'
# filename='MSE 3114 drink pref.csv'
# fullpath=os.path.join(path,filename)
# raw=pd.read_csv(fullpath)

# To direct read a zip file containing a csv file
# fullpath="https://drive.google.com/uc?id=1uBJd4eIZgYL38YyG4AZsbpGvBuH9KCsQ"
# raw=pd.read_csv(fullpath,compression='zip')

# This is a live google sheet file linked to our google form poll responses.  The file must be shared to be read it this way.
fullpath="https://docs.google.com/spreadsheets/d/13PLZ2N8txdPGn9P19VINPAMDup7ExLsh_Dso9_qLw0c/export?format=csv"
raw=pd.read_csv(fullpath)
raw.tail(5)  #shows last 5 rows
| Timestamp | Score | If I have to choose between Pepsi and Coke, I prefer to drink Pepsi. | If I have to choose between Sweet Tea and Unsweet Tea, I prefer to drink Sweet Tea. | If I have to choose between Water and Vanilla flavored Almond Milk, I prefer to drink Water. | |
|---|---|---|---|---|---|
| 53 | 9/7/2023 12:11:41 | NaN | Neutral | Agree | Strongly Agree |
| 54 | 9/7/2023 15:42:29 | NaN | Disagree | Strongly Agree | Strongly Agree |
| 55 | 11/30/2023 14:49:56 | NaN | Neutral | Strongly Agree | Agree |
| 56 | 9/10/2024 10:24:44 | NaN | Neutral | Agree | Strongly Agree |
| 57 | 9/10/2024 11:08:12 | NaN | Strongly Disagree | Strongly Agree | Strongly Disagree |
You can see here the survey responses are in the 3rd, 4th, and 5th columns.
Do you remember how to slice a DataFrame using .loc and .iloc?
Let’s take the 3rd, 4th, and 5th columns. Since we are requesting more than one column, we will pass a list of columns in the 2nd position of .iloc[rows, columns], e.g. .iloc[:, [2,3,4]]. See the pandas guide for more information on pandas.DataFrame.iloc
data=raw.iloc[:,[2,3,4]]
data.head()
| If I have to choose between Pepsi and Coke, I prefer to drink Pepsi. | If I have to choose between Sweet Tea and Unsweet Tea, I prefer to drink Sweet Tea. | If I have to choose between Water and Vanilla flavored Almond Milk, I prefer to drink Water. | |
|---|---|---|---|
| 0 | Strongly Disagree | Agree | Strongly Agree |
| 1 | Neutral | Strongly Agree | Strongly Agree |
| 2 | Disagree | Disagree | Disagree |
| 3 | Strongly Disagree | Strongly Agree | Strongly Agree |
| 4 | Agree | Agree | Strongly Agree |
Let’s shorten our column names. The column labels are given by data.columns so we can rename them by setting data.columns directly to the new values.
data.columns=['PepsiNotCoke', 'SweetTeaNotUnsweet', 'WaterNotAlmondMilk']
data.head()
| PepsiNotCoke | SweetTeaNotUnsweet | WaterNotAlmondMilk | |
|---|---|---|---|
| 0 | Strongly Disagree | Agree | Strongly Agree |
| 1 | Neutral | Strongly Agree | Strongly Agree |
| 2 | Disagree | Disagree | Disagree |
| 3 | Strongly Disagree | Strongly Agree | Strongly Agree |
| 4 | Agree | Agree | Strongly Agree |
We also need to convert the terms: “Strongly Agree = 4, Agree = 3, Neutral = 2, Disagree = 1, Strongly Disagree = 0” to numeric values to better analyze our results. The easiest way is to use a dictionary “{ }” or key:value pairs and use the function replace(). The notation looks like this:
data=data.replace({'Strongly Agree': 4, 'Agree': 3, 'Neutral': 2, 'Disagree': 1, 'Strongly Disagree': 0})
data.head()
| PepsiNotCoke | SweetTeaNotUnsweet | WaterNotAlmondMilk | |
|---|---|---|---|
| 0 | 0 | 3 | 4 |
| 1 | 2 | 4 | 4 |
| 2 | 1 | 1 | 1 |
| 3 | 0 | 4 | 4 |
| 4 | 3 | 3 | 4 |
Now let’s get some statistical data. Pandas makes this easy with the describe() function:
data.describe()
#the 50% percentile is equal to the median
| PepsiNotCoke | SweetTeaNotUnsweet | WaterNotAlmondMilk | |
|---|---|---|---|
| count | 26.000000 | 26.000000 | 26.000000 |
| mean | 1.538462 | 3.346154 | 3.384615 |
| std | 1.240347 | 0.935620 | 1.061204 |
| min | 0.000000 | 1.000000 | 1.000000 |
| 25% | 1.000000 | 3.000000 | 3.000000 |
| 50% | 1.000000 | 4.000000 | 4.000000 |
| 75% | 2.000000 | 4.000000 | 4.000000 |
| max | 4.000000 | 4.000000 | 4.000000 |
data.describe().iloc[1] #we could grab the mean data from above
PepsiNotCoke          1.538462
SweetTeaNotUnsweet    3.346154
WaterNotAlmondMilk    3.384615
Name: mean, dtype: float64
data.mean() #or we could use of mean() function
PepsiNotCoke          1.538462
SweetTeaNotUnsweet    3.346154
WaterNotAlmondMilk    3.384615
dtype: float64
Let’s change the order of our columns so that they correspond with the order of the mean values.
data.mean().sort_values(ascending=False) #this provides a sorted list of mean values
WaterNotAlmondMilk    3.384615
SweetTeaNotUnsweet    3.346154
PepsiNotCoke          1.538462
dtype: float64
The above hasn’t changed our data in any way. It just gave us a list of sorted column names along with their mean. Now we could take this sorted list of header names and reindex our data columns.
header_names_sorted=data.mean().sort_values(ascending=False).index
data=data.reindex(header_names_sorted, axis=1) #axis=1 means reindex columns, rows are axis=0
data.head()
| WaterNotAlmondMilk | SweetTeaNotUnsweet | PepsiNotCoke | |
|---|---|---|---|
| 0 | 4 | 3 | 0 |
| 1 | 4 | 4 | 2 |
| 2 | 1 | 1 | 1 |
| 3 | 4 | 4 | 0 |
| 4 | 4 | 3 | 3 |
3.3. Plotting using pandas#
Note
pandas uses matplotlib to graphically represent data organized in DataFrames. Using pandas allows us to make complicated figures with very little coding. We will look at several examples.
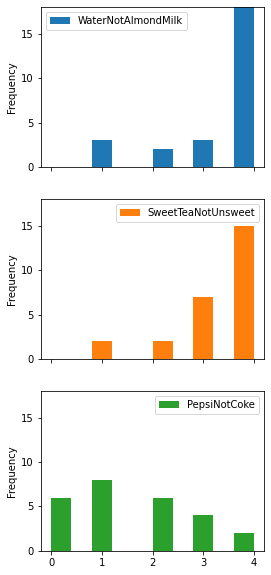
3.3.1. Histogram#
ax=data.plot.hist(subplots=True, legend=True, layout=(1, 3), figsize=(15,4)) #pandas plotting
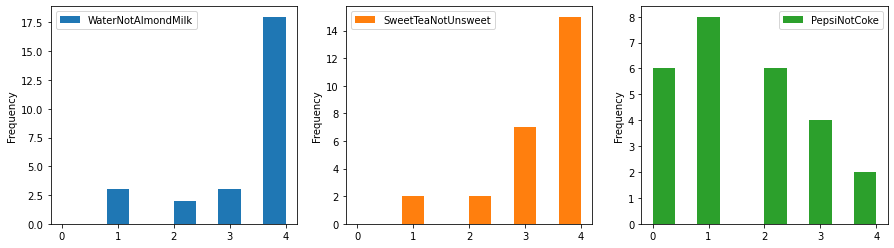
I think maybe this will look better stacked and notice the plots are sorted by mean value since we changed the order of our columns previously.
ax=data.plot.hist(subplots=True, legend=True, layout=(3, 1), figsize=(4,10), bins=10, ylim=[0,18]) #pandas plotting
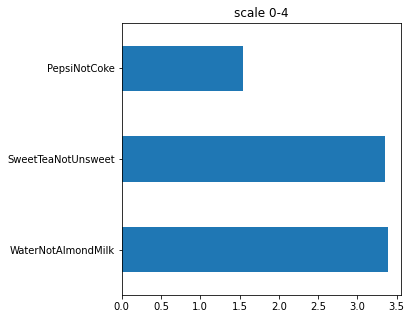
3.3.2. Bar charts#
We could also make a horizontal bar chart of our mean values:
data_mean=data.mean()
ax=data_mean.plot(subplots=True,kind='barh',figsize=(5,5), stacked=True, label="scale 0-4")
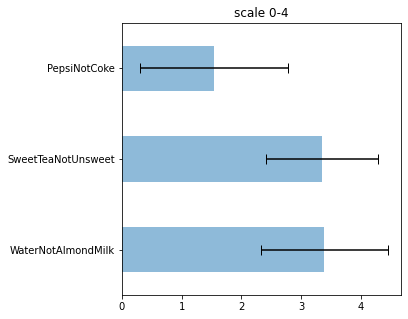
ax=data_mean.plot(alpha=0.5,subplots=True,kind='barh',figsize=(5,5), stacked=True, label="scale 0-4",xerr=data.std(), capsize=5)
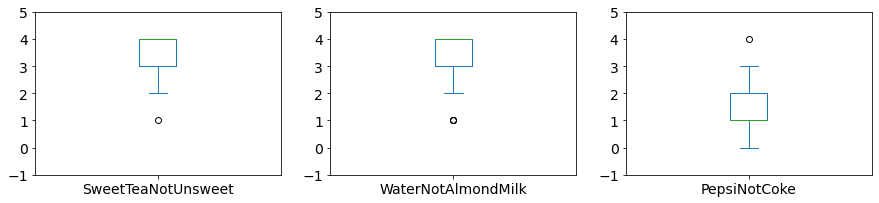
3.3.3. Box plot#
Another type of plot that can be useful is the box plot. Here is the meaning of the box plot:
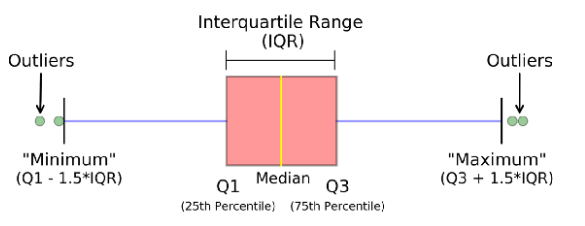
ax=data.plot(subplots=True,kind='box',figsize=(15,3), ylim=(-1,5), layout=(1,3), fontsize=14)
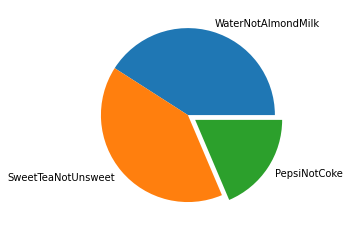
3.3.4. Pie chart#
ax=data_mean.plot(kind='pie', explode=[0,0,0.1], labels=data_mean.index, label="", shadow=False, startangle=0)
3.3.5. scipy.stats#
Let’s use a paired t-test to see if the mean values for our data are significantly different from one another. We will use the standard p-value of <= 0.05 to conclude that the means are significantly different.
Here we test whether the preference to drink Pepsi over Coke is significantly different than the preference to drink Water over Almond Milk.
t,p=stats.ttest_rel(data.loc[:,'PepsiNotCoke'], data.loc[:,'WaterNotAlmondMilk'])
print(t)
print(p)
-5.820855000871991
4.538064084376436e-06
Since our p value shown above (3.57e-6) is less than 0.05, we conclude that their is a significant difference in preference for drinking Pepsi over Coke as compared to drinking Water over Almond Milk. In the example above, a mean of 2.0 would be no preference. Based on the data the class has a preference for coke and a preference for water. Now lets compare the mean of WaterNotAlmondMilk to the mean of SweatTeaNotUnsweet.
t,p=stats.ttest_rel(data.loc[:,'SweetTeaNotUnsweet'], data.loc[:,'WaterNotAlmondMilk'])
print(t)
print(p)
-0.13736056394868904
0.8918461009519117
Since our p value above is greater than 0.05, we conclude that the mean of WaterNotAlmondMilk is statistically the same as the mean of SweetTeaNotUnsweet.
Here are some khan videos on the t-test if you are interested but you will get more of this in Design of Experiments.
3.4. Exercises#
3.4.1. Problem 1#
For homework, create your own survey in Google forms that will allow you to rank at least 4 features /items by collecting opinion data on 4 corresponding survey questions and have at least 10 people take it. The more data you have the better if you can get more than 10. Send it to family, friends, etc. The 4 questions should use the same scale so that you will be able to compare. Use the 5-point likert scale.
Download your survey responses and find the mean, std, median, max and min values for each column. Analyze your survey data by creating at least 3 different plots/charts summarizing aspects of your data. Perform a t-test to compare the mean values between three pairs of data. Indicate whether the mean values are significantly different from each another for each pair.
At least one of your plots/charts should be something that I did not do in the lesson.
3.4.2. Problem 2#
df=pd.DataFrame([[3, 4, 0],[4, 4, 2],[1, 1, 1],[4, 4, 0],[3, 4, 3],[4, 1, 0],[4, 4, 1],[2, 4, 0],[4, 2, 3],[4, 4, 0]], columns=['SweetTeaNotUnsweet', 'WaterNotAlmondMilk', 'PepsiNotCoke'])
df
| SweetTeaNotUnsweet | WaterNotAlmondMilk | PepsiNotCoke | |
|---|---|---|---|
| 0 | 3 | 4 | 0 |
| 1 | 4 | 4 | 2 |
| 2 | 1 | 1 | 1 |
| 3 | 4 | 4 | 0 |
| 4 | 3 | 4 | 3 |
| 5 | 4 | 1 | 0 |
| 6 | 4 | 4 | 1 |
| 7 | 2 | 4 | 0 |
| 8 | 4 | 2 | 3 |
| 9 | 4 | 4 | 0 |
I’m trying to perform a slice of the above data to get the 1st and 3rd columns along with the 4th, 5th, and 6th rows as shown below.
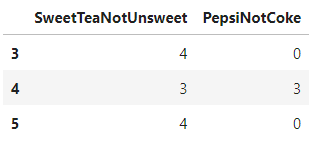
I tried the following line of code but it doesn’t work.
df.iloc[[0,2],3:5]
| 0 |
|---|
| 2 |
Correct this line of code to give the desired output.
3.4.3. Problem 3#
I’m trying to find the sqrt of 3 using numpy but I’m getting the following error. What is wrong?
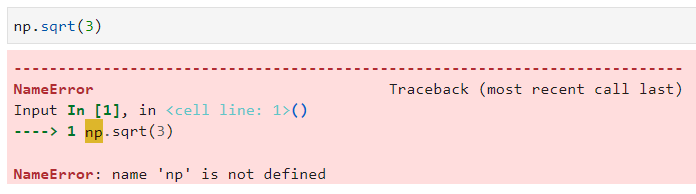
To do this problem, you want to open a new blank notebook. Then type np.sqrt(3), in the first line and run it.
3.4.4. Problem 4#
Why is the cosine of 90 degrees below giving me the wrong answer?
np.cos(90)
-0.4480736161291701